

In everyday life we are generating huge amounts of data which we are increasingly attempting to use for improved and innovative outcomes to meet corporate objectives. It is therefore necessary to think about managing our data efficiently to ensure it is accurate, accessible, and secure throughout its lifecycle. Manual processes and disparate approaches are no longer adequate as they are time-consuming, error prone and expensive. In this interview with Michael Covarrubias, VP of Solutions and Strategy, speaks about how Xtensible through its consulting practice has converged on six data nodes and how to combine them to unleash the full potential of a managed data fabric.
What was the thinking behind the data nodes?
We have tended to think about the data journey in a linear and largely segmented fashion. We utilize different technologies during different stages. Very often these technologies are loosely connected requiring manual intervention, or worse, they may not interact at all, reducing the ability to gain insights and increasing complexity.
"We need to approach the data journey not as something linear and static even but something constantly evolving requiring different thinking and technology."
We needed to unify our approach and delivery methodologies to bring different groups together in the enterprise to reduce complexity, for faster time to market, and for additional business value.
What do you see as the first data node?
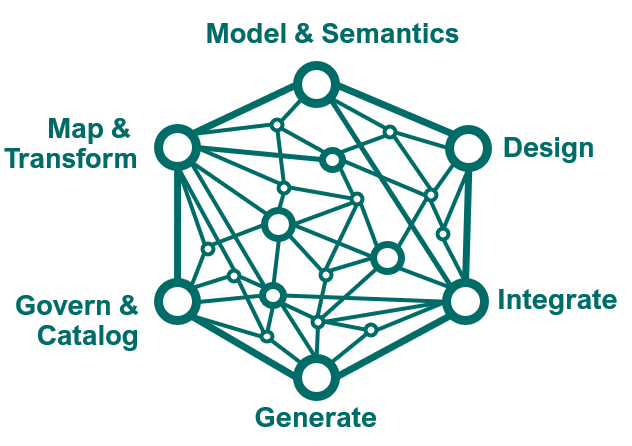
The first data node is “Govern and Catalog”. You don’t know what you don’t know. When you catalog the data your data inventory is created. This includes not only the technical metadata for a specific database, such as names, definitions, and attributes, utilized by a specific operational solution, but also 3rd party API definitions, and even the metadata for your data store, which is comprised of a subset of your own data, and likely augmented by data from external sources. We will get back to why when we talk about the other data nodes. Governing then enforces business rules, processes, policies, and standards on your data to ensure a high-level of assurance in what is being delivered. It also includes defining roles and responsibilities and ensuring compliance with legal and regulatory requirements. Both “Catalog and Govern” are on-going efforts to assess data and to review and revise existing processes for when people and technologies change.
How do you work with similar or same metadata from different sources?
That question leads to the second data node “Model & Semantics”. Data models and semantics describe how your organization operates and makes use of data. The semantic model for your enterprise is created from industry standards and your catalog. Industry standards can be viewed as a common language understood by technology providers and enable interoperability. The semantic model is the unambiguous definition of the data, which allows for efficient exchange and reuse of data. It is a metadata model that contains physical database objects that are abstracted and modified into logical dimensions. It is designed to present data for analysis according to the structure of the enterprise. This is where analysts and business users look for the data they need for analytics and operations. Where the data is served from in the end is a different data node.
It is a relief that you don’t have to search every database when you need something. Where do we go from here?
The third data node is “Design”. Data and integration design describes how data is stored and moved between systems and solutions both internal and external with respect to your enterprise. Taking an organized approach, based on semantics, ensures consistency across your designs, and enables reusability. For example, you might want to design a datastore for an analytics report, or something comprehensive such as a foundational datastore for an analytics platform. By using a subset of the semantic model, you build a design context for your analytics reports, and a different design context for your analytics platform. The same approach is valid for individual interfaces. An interface does not necessarily expose all available classes of a data model. This is where the ability to physicalize data within the enterprise is taking shape and is key for analytics and data exchange.
I say “vacation” and you say “holiday”, how about transformations?
The fourth data node is “Map & Transform”. This is about capturing the manipulation of data that inevitably occurs within an organization which makes it suitable for analysis and processing. It includes both object and attribute mappings from source to target, in other words where the data comes from and where it goes. Sources and targets do not see data the same way, Fahrenheit and Celsius being an obvious example. Data normalization, aggregation, even reduction happens in this data node.
"One aspect of mapping and transformation rules working in conjunction is the ability to encode and encrypt sensitive data consistently with access provided through the connectivity to catalog and govern."
Too many times mapping and transformation information is captured separately, vital information, but is then not connected directly to the data journey. We see mappings and transformations built upon designs utilizing the enterprise semantic model resulting in a unified technology approach. This enables visibility and continues to build the understanding of the end-to-end data journey.
Technology landscapes and how they work together seem daunting. Does the next data node help?
The fifth data node is “Integrate”. The approach to integration can be streamlined. An integrated organization has an end-to-end view of its data and associated metadata. Investments in different technologies for managing the data journey are bridged for a comprehensive and consistent view of data that can be used for analysis, decision-making, and other purposes. Integrations define and document how the various components of integrations work together, from API or database definitions of a source system, the schema definitions of data payloads, the data mapping and transformation to a target schema, and ultimately the API or database definitions of the target system. Regardless of if you are extracting, transforming, and loading into a target system such as a data store or building a visualization layer without physically moving the data, building on the previous data nodes ensures accuracy, consistency and reduces repetitive re-work for integrations.
Since we have reached the sixth and last data node, is this where the rubber meets the road?
The sixth data node is “Generate”. This is the ability to physicalize data-at-rest or data-in-motion through automation. It is most effective when design artifacts are connected to the generated code as organizations continue to evolve based on technology advancements, consumer expectations, policy changes and even regulatory compliance. The result is a need to augment and continuously expand technology environments. Connected design artifacts create a clear line of sight from the source of the data, through the movement, transformation, storage and finally the usage of data. Imagine having the ability to generate a physical model from your logical data model in the form of MS SQL, MySQL, SAP Hana, or Oracle for your analytic data stores!
Now that we have the six data nodes, what is the significance?
Our clients already perform activities associated with the six data nodes, but they are not fully connected. This leads to time spent on repetitive work instead of generating value added insights. Imagine what it would be like if the data nodes were connected?
Imagine what would happen if the organization spoke the same language, i.e., the semantic model. Imagine if this model was the basis for your designs, leading to mappings and transformations, for your integrations and ultimately for generating your data store for instance. How many spreadsheets or word documents with designs, and mappings etc. could you eliminate?
How do you see the data nodes in context of the change we are constantly experiencing? Technologies, people, and processes?
In working with our clients, we constantly improved our methodologies and productive tools, to the point where clients asked to use them. This is where we thought about unifying our approach, resulting in the six data node, and ultimately in our product Affirma, a semantics modeling and metadata management solution, where the data nodes, representing different technologies and home-grown solutions are connected.
“Connecting the data nodes unleashes the creativity of your employees to approach problems with data at their fingertips instead of having to search for it. Time much better spent!”
Affirma provides capabilities lacking in today’s technology landscape or only available as stand-alone solutions. Affirma does not replace technologies, but rather augments, and connects them. Imagine the effort to fully comprehend the changes when you decide to replace an existing technology or adding something now. With Affirma, data linage and history are at your fingertips.
Today and for the foreseeable future we will be experiencing significant shifts in both personal and corporate behavior triggered by technological advances, awareness, security, and regulatory requirements. The data journey must become more inter-connected. Want to know how? Learn more about Affirma and how to navigate change! Speak to a member of the Xtensible team.
ABOUT THE AUTHOR

Michael Covarrubias
VP, Solutions and Strategy at Xtensible

Erika Ferguson
Consultant, at Xtensible